Net immigration now slowing strongly and will be 30,000 by end of 2019
Net inward migration is great for the economy within reason. In the past we have thought of a net annual inflow of 15,000 to 20,000 as being high. This is apart from cycles where we have had the large roller-coaster ride. The most recent previous cycle was from 2000 to 2005. In 2000 there was net outflow of 10,000 a year, then a rapid inflow lift and reduced outflow so in 2003 there was a peak net inflow of 40,000 a year. Following that, there was the dip back to 2005 when the net inflow was back to about 5,000 a year.
The current cycle has been much greater, exaggerated partly by the outflow to Australia in 2011 to 2013, following the Christchurch earthquakes and then some back-flow from 2014 to 2017. In 2012 the net inflow was close to zero. By mid-2015 the net inflow was over 60,000 a year and it stayed in the peak range 69,000 to 72,000 from year ending June 2016 to February 2018.
Now the easing back
The departures started increasing in 2016 and have increased slowly but steadily since. The arrivals peaked in early 2017 and have had a trend downwards since. The combination of these trends has the net inflow definitely easing back. By the year ending July 2018, the net inflow was back down to 63,800 and trending further down. We track the annual rate which is reflected in the seasonally-adjusted arrivals less the seasonally-adjusted departures in each month. Multiply by 12 and we get an annual rate. This could be thought of as the July 2018 ‘Spot-rate’ of annual flow. In July 2018, that spot rate is down to 56,600. The trend upwards in departures continues and the track of arrivals, although erratic is generally trending downwards.
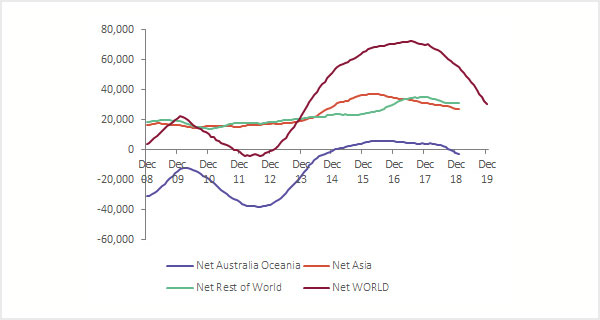
With arrivals falling and departures rising, the peak of the cycle is definitely past, and the track implies that we will have a net migration inflow for calendar year 2019 of 30,000 people. This is still a large number of people to provide infrastructure and services to, but is a lot better than 72,000 a year.
Additional 30,000 people a year in historical perspective
The addition to New Zealand’s population from the annual net natural increase is simply the births less the deaths in each year. For the 47 years from the year 1970 to 2017 the trend annual Net Natural Increase has been very close to 30,000 people per year. There were periods in the 1970s above that and periods in the 1980s below that but from 1990 onwards it has fluctuated around that level. What this means is that our country has been used to providing services to an additional 30,000 people per year. From 2015 to 2018 net immigration has blown that number out to 100,000 a year.
This annual figure looks like coming back to 60,000 a year by 2020. From then onwards it may ease back further, but we are likely to still see the need to cater for significantly more than the additional 30,000 per year.